Cambridge Intelligence ramps range of investigative technology
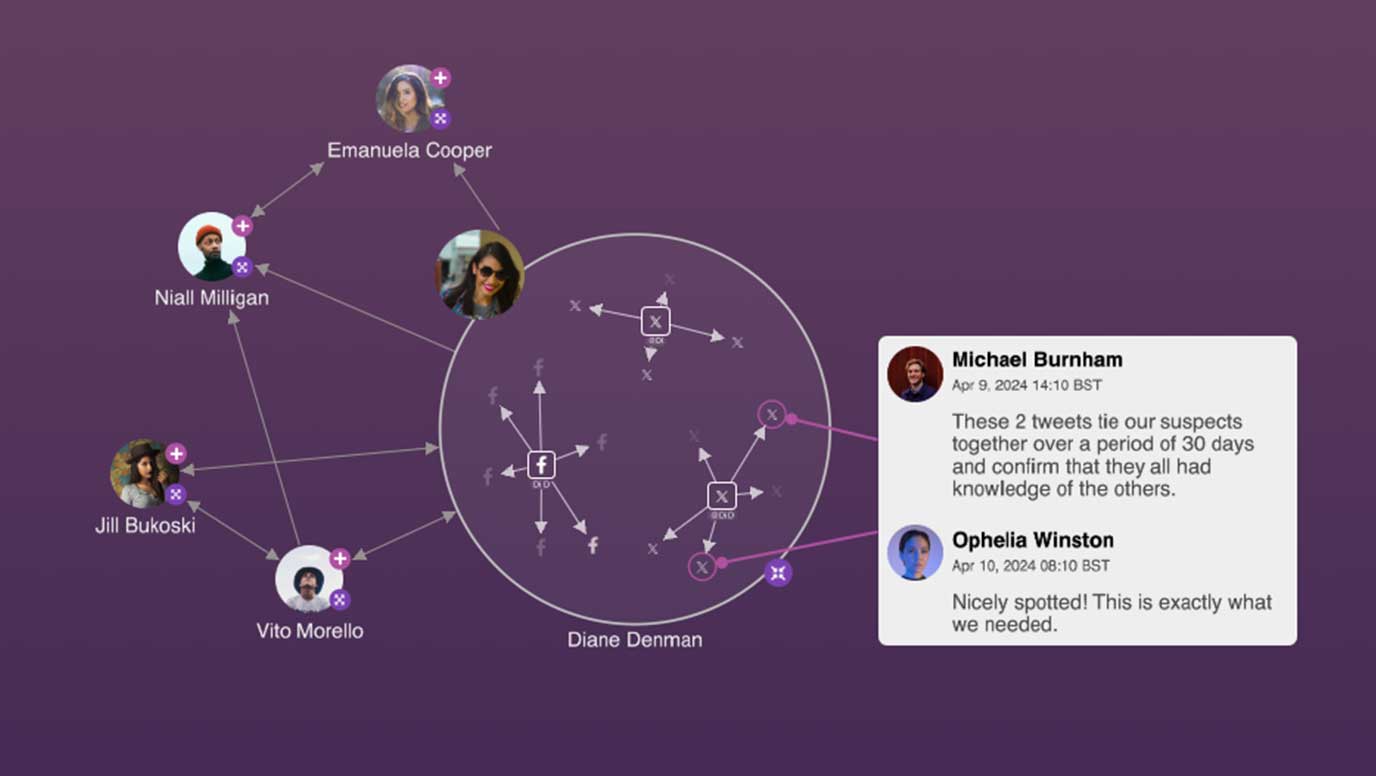
The latest major versions introduce annotations – an intuitive way to tell the story of a dataset and share insights in reports and presentations.
They are poised to enhance the investigative workflow for intelligence agencies, police departments, financial crime teams and cyber threat analysts.
And they play a particularly insightful role with AI and machine-generated data, revealing the story behind connections in a way that’s easy to understand and share.
Cambridge Intelligence has pioneered new ways to visualise complex data since 2011. Hundreds of organisations use KeyLines, ReGraph and KronoGraph to power their data visualisation experiences for fraud detection, cyber threat management and security workflows.
These experiences transform connected data into clear and interactive charts that power investigations and uncover hidden risks and threats.
Data visualisation is an essential part of a wider intelligence cycle. It’s where analysts and investigators explore the underlying story of their complex data to reveal what's happening: this is the data's narrative.
They also need to share and explain that narrative to a wider audience. Annotations let them do that without leaving their existing workflow.
The fully customisable annotations, available across all three toolkits, unlock a smooth and collaborative analysis and reporting experience. They allow analysts to quickly understand and communicate insights that inform smart and timely decisions.
Analysts can add their insights directly to the chart in long-form text notes, or import additional info automatically alongside their dataset. As a collaborative tool, annotations let teammates share findings, contribute expertise and develop the narrative further.
Every use case benefits from the ability to remove ambiguity and make complex connected data explainable. Annotations also meet the growing demand for solutions that enhance the reliability of AI and machine-generated insights.
Sharing and understanding data narratives is essential for case notes, legal evidence and reports to stakeholders. Annotation-rich data visualisations make that narrative accessible to all.
Annotations are exported as part of timeline and graph visualisations – as interactive charts or high-resolution images – ready for compliance documents, team presentations, courtroom submissions or any other output.
The result is a joined-up analysis and reporting experience that powers faster, better-informed decisions.
“With the scale of modern data, the complexity of the threat landscape, and the rise of AI, software companies are rethinking how they explain information to end users,” says Dan Williams, Head of Product Management.
“Annotations are critical to ensuring that analysts, investigators and decision makers understand the recommendations, insights and alerts that modern technology provides.”
• The annotations layer is available to customers of Cambridge Intelligence’s toolkits. To submit a trial request, go to https://cambridge-intelligence.com/try/